|
<< Click to Display Table of Contents >> Trend Chart Properties - Pens |
  
|
|
<< Click to Display Table of Contents >> Trend Chart Properties - Pens |
|
The pens on a Trend Chart are setup using the Pens tab on the Trend Chart Properties box.
Variables can be assigned by selecting (or multi-selecting) in the Variables List and dragging & dropping directly into the Pens box.

Note: If a variable that that is not currently being logged is added to a Trend Chart then logging is automatically enabled for this variable. This can be disabled by subsequently un-checking the logging checkbox in the Variables List.
Maximum number of Trend chart Pens
There is no limit to the number of pens on a Trend chart BUT the number of labels that can be shown is limited by:
• The length of the label
• The width of the chart
• The size of the Font selected for the chart
If more pens are defined than can be shown on the top line of the chart:
• A '>' symbol to the right of the last label indicates that not all of that label is displayed
• A '+' sign to the right of the last numeric value indicates that not all of the defined pens are shown
The Move Up and Move Down buttons set the order of the pens along the top of the chart. They also determine the priority of each pen trace, with the highest priority pen at the top of the list, such that if a pen trace overlaps another then the higher priority pen trace will be drawn on top.
Clicking the Add or Edit buttons opens the Pen Properties box:

| • | If a variable isn't already assigned then drag and drop from the Variables List, or click the Choose button. |
| • | The pen Label, Units and Description can be entered. Check the boxes on the Values tab to see the Units/Description on the Trend Chart. |
| • | DP is used to set the decimal places, up to 4 DP and also in scientific notation. Or in the case of plotting a time variable, the precision of it. |
| • | The appearance of the pen trace can be made to change (color and/or blink) based on a boolean alarm. |
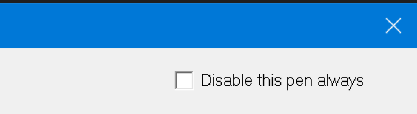
Disable this pen always:
| • | When checked, this options will hide the pen and its associated scale irrespective of other pen properties. |
For example, if Disable this pen always is checked and the boolean variable associated with Enable on Bool is 'On', then the pen and its associated scale will still be hidden.
Additionally, if Disable this pen always is checked, the pen will not appear as an option on the Show/Hide Pens pop up menu or in Historical Replay.
Blink on Alarm from:
| • | When checked, the pen will blink when the associated Alarm is 'On'. |
Drag an alarm parameter to the Alarm parameter field to have it be associated with the pen.
For example, if an Alarm named Alarm1 is 'On' and associated with a pen, then the entirety of the time that Alarm1 is on, the pen will blink on the trend chart.
If Alarm1 is on from 10:00:30 to 13:01:00, then the pen will blink on the trend chart from 10:00:30 to 13:00:01.
The pen will stop blinking on the chart if Blink on Alarm from is unchecked.
Change color on alarm:
| • | When checked, the pen will change color to the chosen color (grey by default) from its native color when the associated Alarm is 'On'. |
Drag an alarm parameter to the Alarm parameter field to have it be associated with the pen.
Choose the color that the pen will change to by clicking on the grey box beside the Change color on Alarm property.
For example, if an Alarm named Alarm1 is 'On' and associated with a pen, then the entirety of the time that Alarm1 is on, the pen will be the chosen color on the trend chart.
If Alarm1 is on from 10:00:30 to 13:01:00, then the pen will change from its native color to its new chosen color on the trend chart from 10:00:30 to 13:00:01.
The pen will not change colors or display different colors if Change color on Alarm is unchecked.

Enable on Bool:
| • | If this boolean variable is 'On' then the pen line will be shown with its associated scale (if the scale for this pen is checked on the Scales tab), and similarly if this boolean variable is 'Off' then the pen line will not be shown with its associated scale. |
| • | By default any Boolean variable used in this way will be marked for logging, this is so that when playing the chart back in Historical Replay the pen(s) will enable and disable based on the values of the boolean(s) at the time. |
| • | If the value of the Bolean cannot be determined, such if it is an instrument value that is not available, then the pen will be shown. |
| • | Export chart data to CSV and Export Range to CSV will always include the data for all pen lines. |

Drawing Mode:
| • | Tolerance Band would allow 2 lines to be drawn (+/-), one either side of a process value making it easy to see when the process value goes outside the tolerance band. This is not currently implemented, see alternative method. |
| • | Other drawing modes will be available in a future version. |
Scale:
| • | The Scale box works in conjunction with the Pen Scales tab. Use the Pen Scales tab to specify which parameters have a scale, and whether they are shown on the left or right. |
| • | By default, scales are set to Auto. This means that the scale will automatically adjust according to the value. |
| • | The scale can also be Fixed to a Max and Min, or set From Variables, for example, Lo Range and Hi Range instrument variables. If the scale is From Variables and these values are not available over comms the Fixed Max and Min will be used for the scale. |
| • | The scale can also be Logarithmic, which is useful for pressure and vacuum measurements. Note that scientific notation is available on the DP drop-down-menu for very big or small values. |
There are also math functions (Power, Log-10 and Log-e).

| • | The scales can have Major Divisions/Minor Divisions shown either as just tick-marks or with Show Values. |
| • | If the divisions are set to Auto then the Minor Division will be half the Major Division. |
| • | Use round numbers if using fixed scales (such as numbers that end in a 0 or a 5); this allows the divisions to be better placed for clarity. |
Gridlines:
| • | When the orientation of the chart is horizontal (as specified in the Chart tab) then the gridlines will be horizontal. |
| • | Fixed lines can be set in addition to the Major and Minor division lines. |
| • | If the gridlines for the Major Divisions and/or the Minor divisions are setup on more than one pen trace, and those gridlines happen to overlap, then the gridlines for the pen nearest the top of the list of pens on the Pens tab will take precedence (be drawn on top). |
Scales for any pens, left or right:
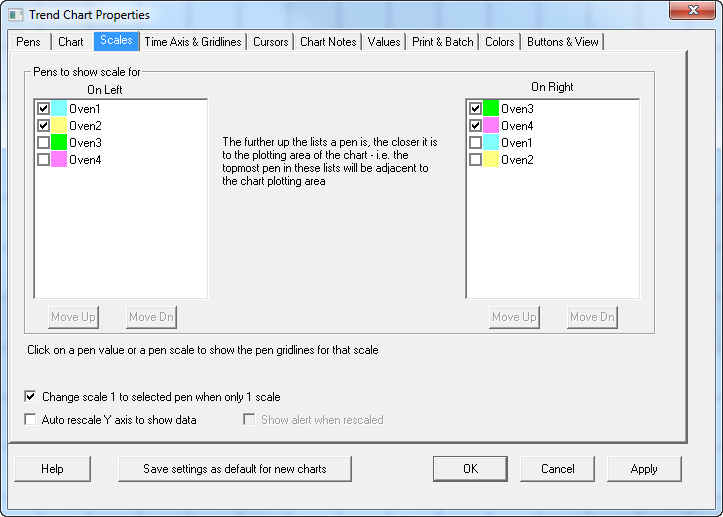
This chart has 2 scales on the left and 2 on the right:
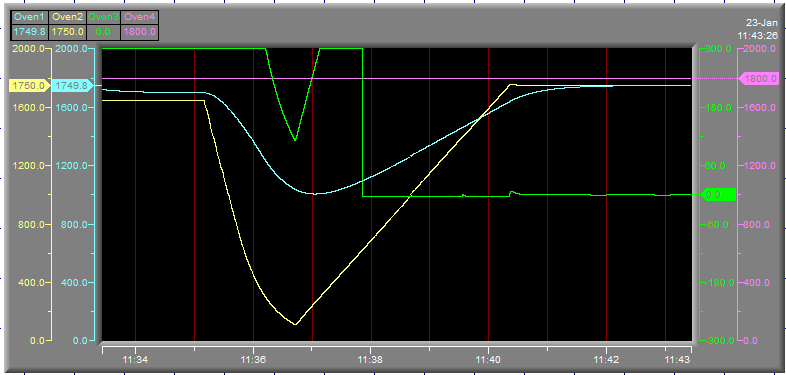
The further up the list a pen is, the closer it is to the plotting area of the chart, hence the topmost pen in these lists will be adjacent to the chart plotting area. So in the example above the scale for Oven 1 is shown nearest the chart plotting area.