|
<< Click to Display Table of Contents >> Trend Chart Properties - Chart |
  
|
|
<< Click to Display Table of Contents >> Trend Chart Properties - Chart |
|
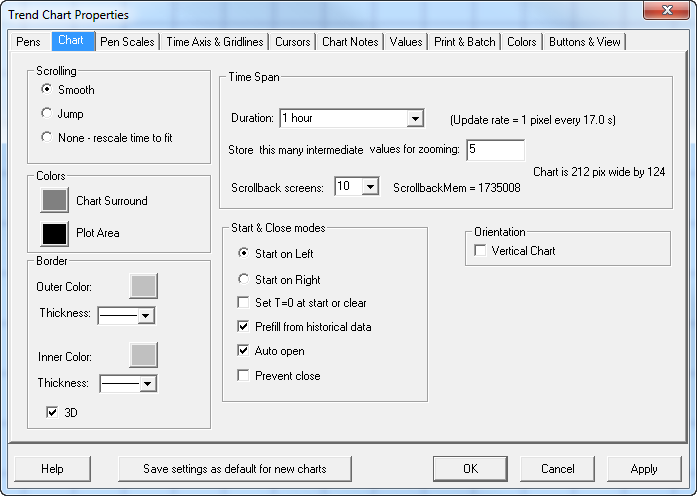
Determining the resolution of a Trend Chart
SpecView will draw one pixel on the Trend Chart pen line according to the time span of the chart & the width of the chart in pixels. Therefore if the time span of the chart is 28 days & the chart is 1000 pixels wide then one pixel will be drawn and every 40 minutes. This also applies to the rate at which the values shown along the top of the chart will be updated.
To ensure the current values can be seen put the values out onto the screen from the Variables List.
Time Span
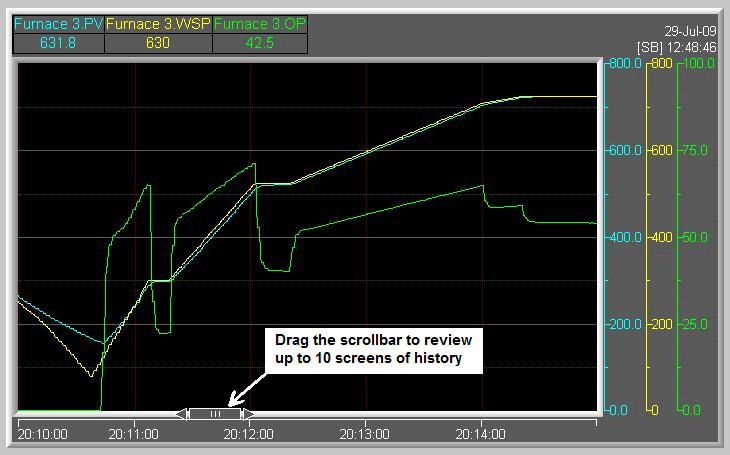
Trend charts can have a scrollback thumb along the time axis to allow the chart to be scrolled back to view up to 10 chart-widths of previous data.
This data is independent of Data Logging and Historical Replay. Therefore, scrollback will still work even if Logging is disabled and if there is no Historical Replay option on the dongle.
Note: When there is no Historical Replay option on the dongle then scroll-back is limited to ONE chart-width only.
| • | Duration is the width of the time-axis of the visible chart. The rate that pixels will be added to a pen trace on the chart can be calculated by taking the actual width of the chart in pixels on the screen, and dividing by the chart Duration. For example, a chart with a duration of 30 mins (1,800 seconds) that is 400 pixels wide, will have one pixel added to each pen trace every 4.5 seconds. |
| • | Scrollback screens specify the amount of previous data, as a multiple of the duration, that can be accessed using the scrollback thumb. For example, if the Duration is 30 minutes, and there are 10 Scrollback screens then the total amount of previous data that can be viewed using the scrollback thumb is 300 minutes. The number of scrollback screens cannot be set if Scrolling is set to None, this is because all the data is visible in the plot area. |
Note: Beware of memory usage. This is because, for example, a 30 minute chart with 10 scrollback screens, storing 10 Intermediate values, would use about 26Mb of memory.
Note: When there is no Historical Replay option on the dongle then scroll-back is limited to ONE chart-width only.
| • | Store this many intermediate values for zooming - is the number of additional data values that are stored (but not Logged) between pixels and can be used to fill in the pen trace lines when the chart is zoomed. For the chart in the example above, where a pixel is added to the pen traces every 4.5 seconds, if the Intermediate value for zooming was 8, then a point would be stored every half second. These extra points would be seen when the chart is zoomed. However, these intermediate values are only stored in memory and are not logged to disk for use in Log Reports and Historical Replay. |
Note: To avoid compromising the performance of the system, it is important that the speed of these intermediate values is not too high, otherwise comms could be overwhelmed.
Note: It is not possible to zoom a chart in Edit Mode as clicking to drag out a zoom rectangle would conflict with clicking to drag the chart to move it.
Colors
| • | Chart Surround and Plot Area - choose colors that have good contrast with the text and the trace line colors. The Colors tab is where the default pen colors are set for both dark and light background charts. Dark background charts are considered to be easier to read on a screen, and light background charts are used for printing to save ink. |
Border
| • | Outer Color, Inner Color and Thickness - choose colors that compliment the Chart Surround and Plot Area colors. |
| • | 3D gives the edges of the Trend Chart a beveled appearance, however it needs to be thick enough for the edge to be visible. |
Start & Close modes
| • | Start on Left/Right - indicates whether the pen trace should start on the left or the right of the plot area. |
| • | Set T=0 at start or clear - sets the elapsed time (T) to zero when the chart starts or is cleared. To clear a chart right-click and choose Clear Chart from the popup menu. The elapsed time (T) can be displayed along the time axis from the Time Axis & Gridlines tab. |
| • | Prefill from historical data - note that the prefilled data will only be seen if the chart is set to Start on Right and/or scrollback screens are defined. |
| • | Auto open - begins filling this chart (GDW) as soon as communications start. This happens when going into Runtime Mode, or in Edit Mode when Online Features are enabled from the menu. |
| • | Prevent close - to avoid the operator from closing the chart and stopping it from being updated. |
Orientation
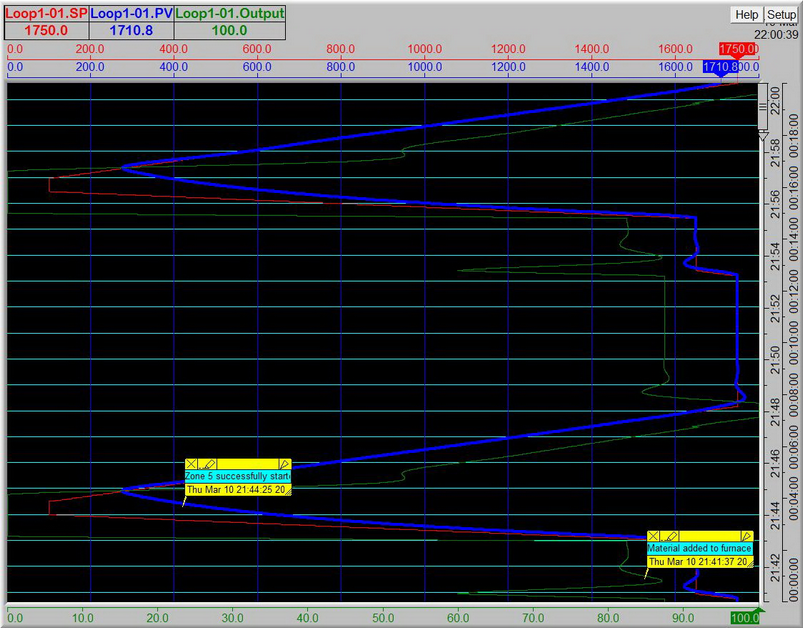
| • | Vertical Chart will make the chart scroll in a way that looks similar to paper chart recorders. |
Scrolling
| • | Smooth - (continuous) scrolling charts are better visually, but be aware of CPU usage as this feature makes heavy use of the CPU. |
| • | Jump - charts that jump use less CPU, because they are redrawn less frequently, which is useful when optimal performance is required. |
| • | None - rescale time to fit - these charts will also jump, which makes efficient use of CPU. These are ideal for batch processes when the whole batch needs to be viewed at once. However, it is not possible to scroll-back a chart in this mode because all the data is visible in the plot area. |