|
<< Click to Display Table of Contents >> Trend Chart Properties - Time Axis & Gridlines |
  
|
|
<< Click to Display Table of Contents >> Trend Chart Properties - Time Axis & Gridlines |
|
This tab is used to setup the time axis and its gridlines.
Choose colors that contrast with the background, and ideally which are different to the colors of the pen traces.
Selecting Auto for Time Axis Major Divisions and/or Time Axis Minor Divisions will mean that the Time Span of the chart will be used to calculate appropriate time intervals for these divisions.
The Show real time X axis shows the current time along the time axis, and depending on whether the Use 24 hour clock box is checked either shows, for example 16:32:59 or 04:32:59PM.
The Show elapsed time X axis shows the time that has elapsed since T (Elapsed Time) was last set to zero.
This axis will commence updating once T has been set to zero.
T can be set to zero in one of 3 ways:
| 1. | From the Chart tab use Set T=0 at start or clear, one or more of these can be specified |
| 2. | Clicking on the chart and choosing Set <current time> as 0 Elapsed Time from the popup menu: |
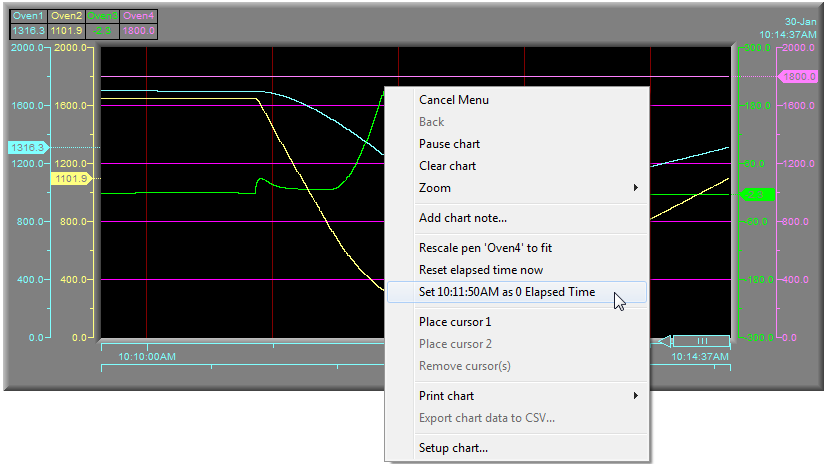
3. The Automatic Batch Interaction on Print & Batch tab can monitor batch interactions, and will set T=0 whenever the specified text variable (with the batch tag property) is given a value to start a batch.
These actions to set T=0 can be performed as often as required.
The current elapsed time will always be recorded, and cannot be removed. Such that the Elapsed time can be seen in Historical Replay if the Elapsed Time axis is being displayed.