|
<< Click to Display Table of Contents >> Trend Chart Runtime - Export Range to CSV |
  
|
|
<< Click to Display Table of Contents >> Trend Chart Runtime - Export Range to CSV |
|
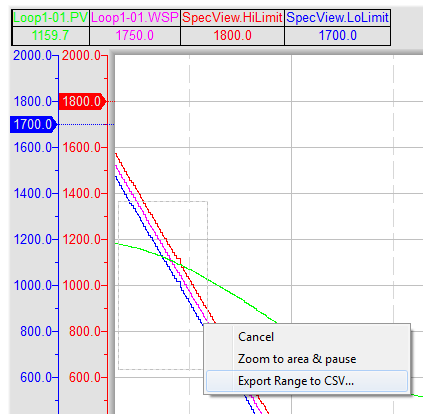
Select an area of the chart and choose ‘Export to CSV’ from the popup-menu. This will create a CSV file containing the values of ALL the variables on the chart between the time at the left of the box to the time at the right of the box.
This is similar, but not the same as, doing a ‘Log Report’ of those variables between that ‘Start Time’ and ‘Stop Time’. The amount of data stored is not the same as the data logging rate – because more data is stored for a trend chart to be used for zooming in ‘real time’.
The CSV file will also have an additional column for milliseconds to give more time precision. This column can be disabled if it is considered more important to have the same columns as in a Log Report than to have the time precision.
[TREND]
CSVExportDateTimeSeparated=1
CSVExportSuppressMS=1
To set the amount of data data stored use the Chart tab on the Trend Chart Properties.
The width of the chart in pixels and the duration of the chart determines the update rate of the chart.
The number of intermediate values gives added detail (precision) for zooming and for export to CSV file.
In this example the 0.1s means that the CSV file will contain about 600 lines for each minute.

To have the same number of lines in the CSV file (for a given duration) as in a Log Report over the same duration, set the number of intermediate values to zero.
However, in this case zooming-in will not give any greater resolution on the data.
There is additional information on the CSV file produced here.