|
<< Click to Display Table of Contents >> Bar Charts |
  
|
|
<< Click to Display Table of Contents >> Bar Charts |
|
Bar Charts display variables as a moving vertical or horizontal bar
The mouse pointer changes to: ![]() Click and drag a rectangle to the shape you want for the Bar chart.
Click and drag a rectangle to the shape you want for the Bar chart.
When you release the mouse button the Bar Chart Setup box and the Variables List are displayed.
NOTE: Bar Charts can also be used with boolean (on-off) variables. Set the bottom value to 0 and the top value to 1. This can be used to indicate alarms.
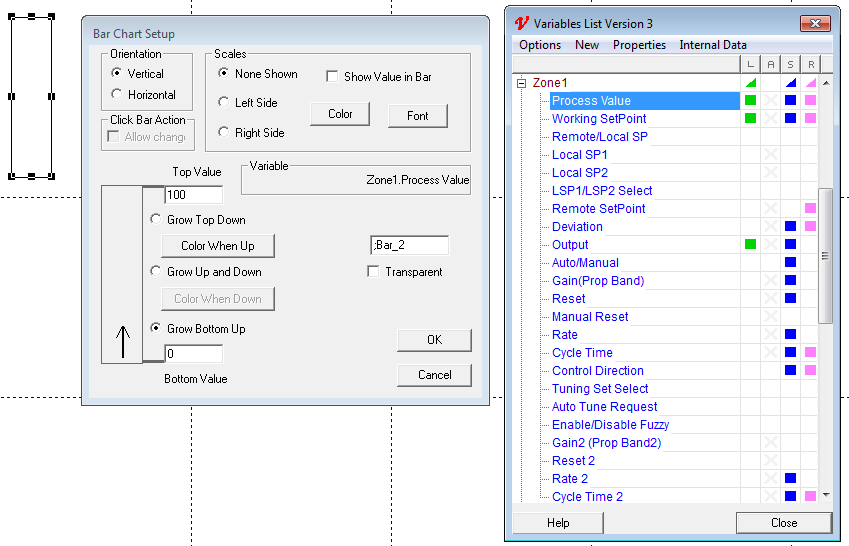
Bar Chart - Variables List
Drag and drop the variable to be displayed on the chart from the Variables List into the Variable field.
Bar Chart - Orientation
Vertical charts grow up / down with increasing values
Horizontal charts grow left / right with increasing values
Growth Direction
Determines the growth direction with increasing value
Use the Grow Up and Down check box (Left and Right) for variables that can go negative such as Deviation/Error and Output Power in heat/cool controllers
Bar Chart - Click Bar Action
If the variable is writeable , checking this box will allow the variable to be changed by clicking on the chart
Bar Chart - Scales
Shows a scale on the chart: 
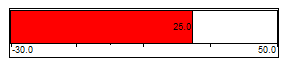
Bar Chart - Show Value in Bar
Shows the numeric value of the Variable in the chart:
NOTE: Use a light chart color to make the numbers more visible
Bar Chart - Font and Color
Sets the Font and outline Colors for the Border, Scales and Values shown on the chart
NOTE: To make the chart disappear when empty, set this outline color to the same as the GDW Paper Color (accessed from the View Menu)
Bar Chart - Fill (empty) Color
The color of the empty part of the chart is set by the Fill Color from the Object Menu.
Firstly ensure that the Bar Chart Setup dialog does not have the Transparent box checked.== }
Single Click the chart to select it (Do NOT double-click)
On the Object Menu select Fill Color
Choose the color from the palette
Bar Chart - Top (Left) and Bottom (Right) Values
Sets the minimum and maximum values of the displayed chart
For ± Variables (Deviation, Output Power with heat/cool) set the Bottom (Right) value to a negative number
Bar Chart - Color When Up (Left) and Down (Right)
Sets the color for the value part of the chart
As of SpecView 3.1.267, users can quickly copy Bar Chart attributes such as Color, Scale, Transparency, No Frame, and Click Bar Action to other Bar Charts.
So, for example, if users had drawn 10 Bar Charts with the "Color When Up" being blue but later decided to change the color to red, they would not have to individually change the color on every Bar Chart.
This is especially useful when using Pre-Plot.
Follow the steps below to quickly copy Bar Chart attributes.
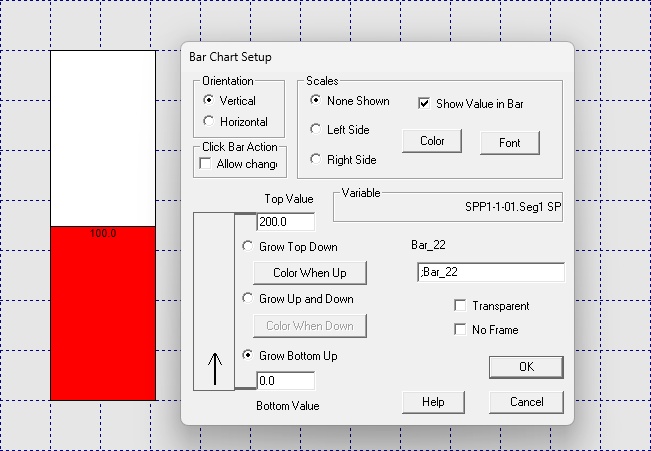
| 1. | Create a Bar Chart and set it up with the appropriate settings. |
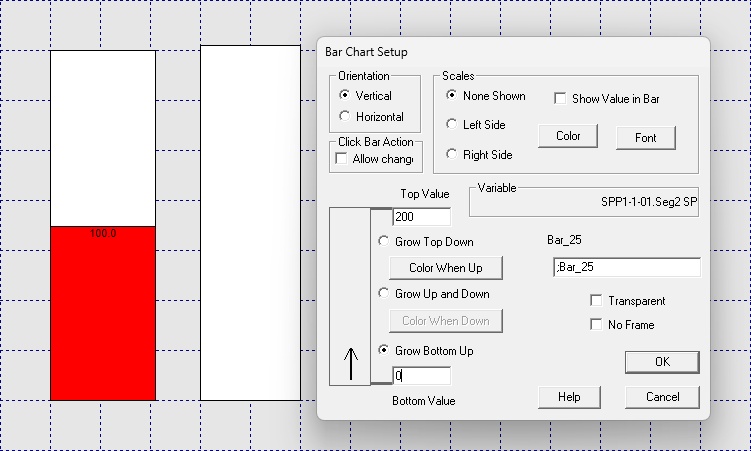
| 2. | Add a second Bar Chart next to the first one from Step 1; on the right side. |
Enter the Top Value, Bottom Value, and Variable in the Bar Chart Setup because these are not automatically copied across.
These are typically unique to each Bar Chart.
| 3. | Select both Bar Chart. |

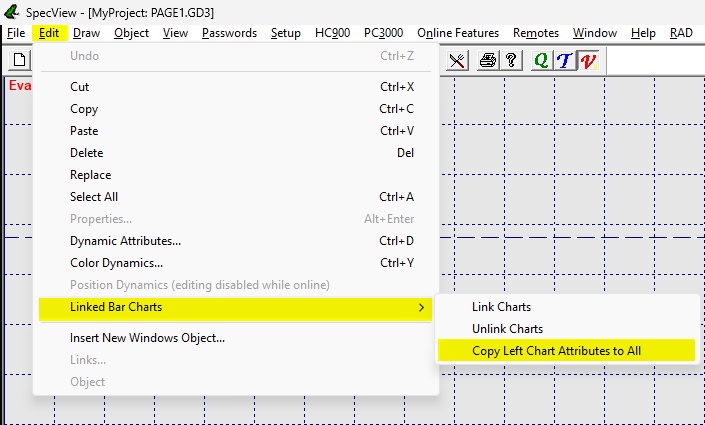
| 4. | Click on "Copy Left Chart Attributes to All" from Edit > Linked Bar Charts. |
Both Bar Charts will now have identical attributes.